GHGRP Chemicals
 The chemical manufacturing sector consists of facilities that manufacture organic or inorganic chemicals. For this summary, the sector is broken down into facilities that produce fluorinated chemicals and non-fluorinated chemicals. The non-fluorinated chemicals subsector comprises facilities that produce adipic acid, ammonia, hydrogen (both merchant and non-merchant plants), nitric acid, petrochemicals, phosphoric acid, silicon carbide, and titanium dioxide. The fluorinated chemicals subsector comprises facilities that produce HCFC-22 (or destroy HFC-23) and other fluorinated chemicals. A more detailed description of these subsectors is provided below. A total of 463 chemicals facilities reported in 2015.
- 2015 Total Reported Direct Emissions from Chemicals (All Subsectors), by Subsector (as of 8/13/16).
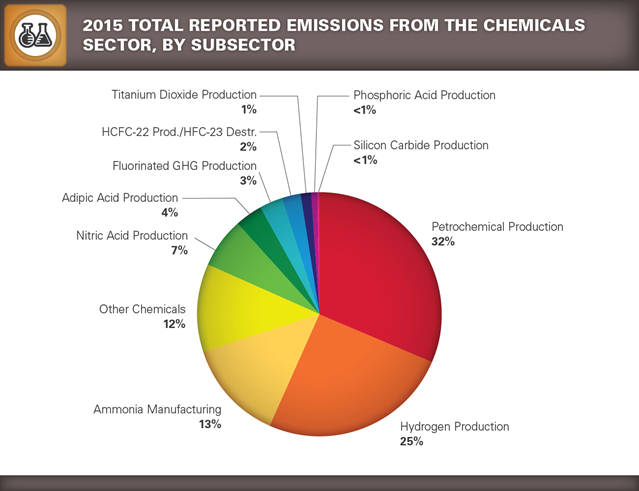
Sum of percentages may not equal 100% due to independent rounding.
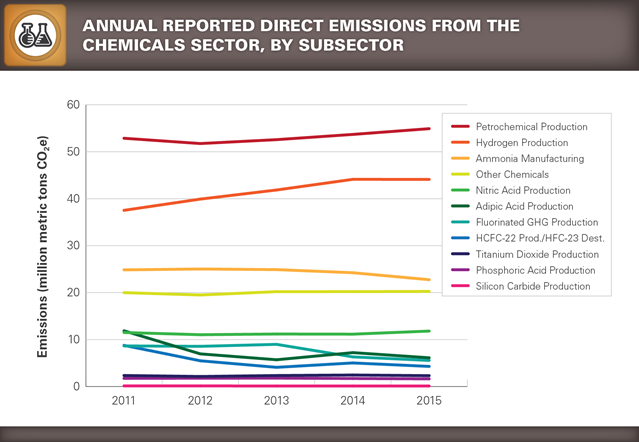
- Trend of Annual Reported GHG Emissions for Chemicals (All Subsectors) (as of 8/13/16).
- Location and emissions range for each reporting facility for Chemicals (All Subsectors) (as of 8/13/16)
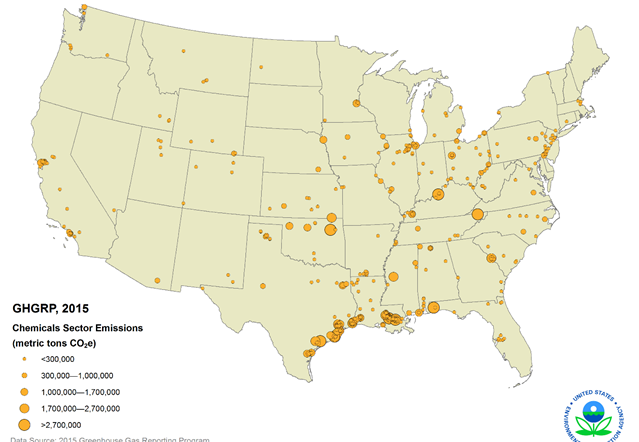
This map shows the locations of direct-emitting facilities. The size of a circle corresponds to the quantity of emissions reported by that facility.
| Chemicals Sector — Greenhouse Gas Emissions Reported to the GHGRP (all emissions values presented in million metric tons CO2e) |
|||||
| 2011 | 2012 | 2013 | 2014 | 2015 | |
|---|---|---|---|---|---|
| Number of facilities: | 457 | 467 | 472 | 462 | 462 |
| Total emissions (CO2e): | 180.3 | 172.3 | 173.8 | 176.3 | 173.9 |
| Emissions by greenhouse gas (CO2e)
|
142.3 0.2 21.3 16.6 |
142.8 0.2 16.0 13.3 |
146.5 0.2 14.8 12.3 |
148.9 0.3 16.6 10.5 |
148.6 0.2 16.0 9.1 |
Emissions by subsector
|
162.9 17.4 |
158.3 14.1 |
160.7 13.1 |
165.0 11.4 |
164.1 9.9 |
Totals may not equal sum of individual GHGs due to independent rounding.
Chemicals (Non-fluorinated)
The non-fluorinated chemical manufacturing subsector consists of facilities that produce adipic acid, ammonia, hydrogen (both merchant and non-merchant plants), nitric acid, petrochemicals (acrylonitrile, carbon black, ethylene, ethylene dichloride, ethylene oxide, methanol), phosphoric acid, silicon carbide, soda ash, and titanium dioxide. In addition to emissions from these chemical production processes, the subsector includes combustion emissions from facilities that produce pesticides, fertilizer, pharmaceuticals, and other organic and inorganic chemicals. A total of 445 facilities reported 2014 emissions under the non-fluorinated chemicals subsector. A small number of facilities in this subsector collect CO2 either for use in their other production processes, to transfer to other users, or to sequester or otherwise inject underground; this subsector includes the CO2 from those process emissions. For example, some of the process emissions reported for ammonia manufacturing plants includes CO2 that is later consumed on site for urea production. This CO2 is not released to the ambient air from the ammonia manufacturing process unit(s).
- Total Reported Direct Emissions from Chemicals (Non-fluorinated), by Subsector, (as of 8/13/16).
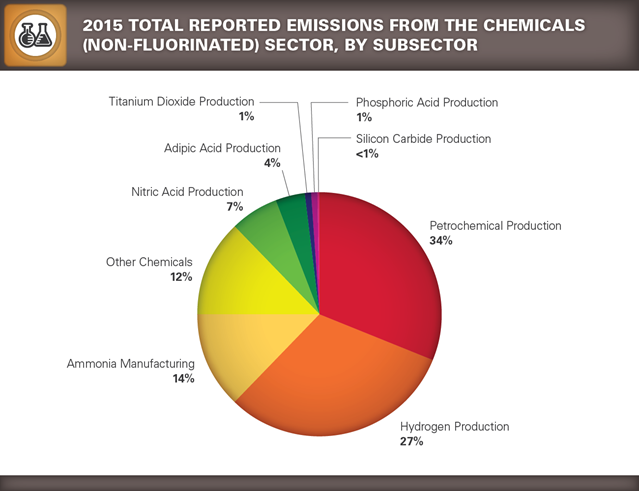
Sum of percentages may not equal 100% due to independent rounding.
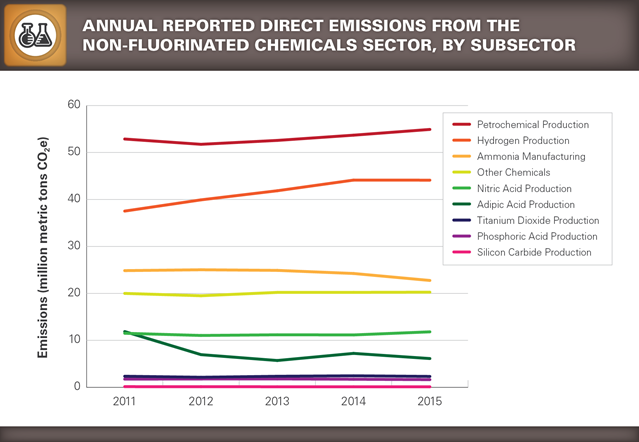
- Trend of Annual Reported GHG Emissions for Chemicals (Non-fluorinated), by Subsector (as of 8/13/16).
- Location and emissions range for each reporting facility for Chemicals (Non-fluorinated) (as of 8/13/16).
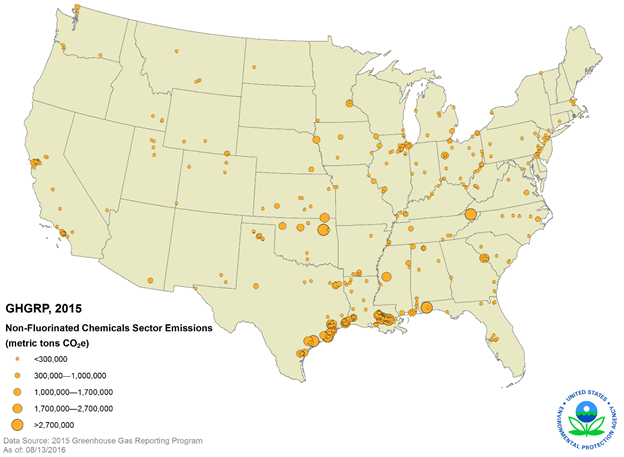
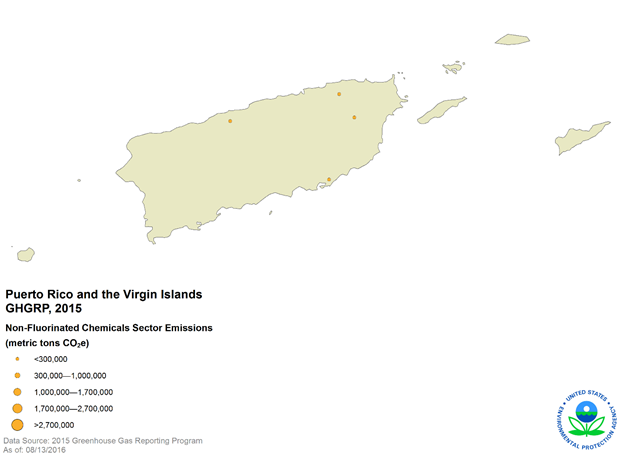
This map shows the locations of direct-emitting facilities. The size of a circle corresponds to the quantity of emissions reported by that facility.
| Chemicals (Non-Fluorinated) Subsectors — Greenhouse Gas Emissions Reported to the GHGRP (all emissions values presented in million metric tons CO2e) |
|||||
| 2011 | 2012 | 2013 | 2014 | 2015 | |
|---|---|---|---|---|---|
| Number of facilities: | 441 | 451 | 456 | 447 | 447 |
| Total emissions (CO2e): | 162.9 | 158.3 | 160.7 | 165.0 | 164.1 |
| Emissions by greenhouse gas (CO2e)
|
141.5 0.2 21.3 |
142.1 0.2 16.0 |
145.7 0.2 14.8 |
148.1 0.3 16.6 |
147.8 0.2 16.0 |
| Number of reporters and 2015 emissions (CO2e) for the Non-Fluorinated Chemicals industry subsector |
||
| Industry Sector | 2015 Number of Reporters | 2015 Emissions (million metric tons CO2e) |
|---|---|---|
| Adipic Acid Production | 3 | 6.1 |
| Ammonia Manufacturing | 22 | 22.8 |
| Hydrogen Production | 110 | 44.1 |
| Nitric Acid Production | 34 | 11.8 |
| Petrochemical Production | 68 | 54.9 |
| Phosphoric Acid Production | 12 | 1.6 |
| Silicon Carbide Production | 1 | 0.1 |
| Titanium Dioxide Production | 7 | 2.3 |
| Other Chemicals | 213 | 20.3 |
Fluorinated Chemicals
The fluorinated chemical subsector includes facilities that produce hydrofluorocarbons (HFCs), perfluorocarbons (PFCs), sulfur hexafluoride (SF6), nitrogen trifluoride (NF3), other fluorinated GHGs such as fluorinated ethers, and chlorofluorocarbons (CFCs) and hydrochlorofluorocarbons (HCFCs), including chlorodifluoromethane (HCFC-22). The subsector also includes facilities that destroy HFC-23, which is a by-product of HCFC-22 production and which may be emitted from the destruction process. This subsector does not include industries that use these fluorinated GHGs (i.e. semiconductors).
- Total Reported Direct Emissions from Fluorinated Chemicals, by Subsector (as of 8/13/16).
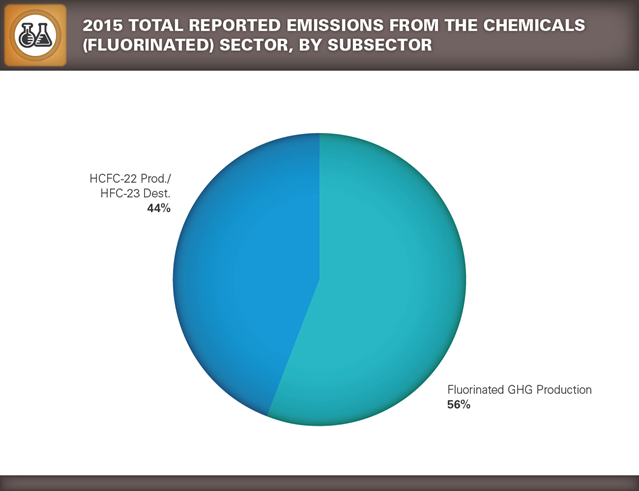
Sum of percentages may not equal 100% due to independent rounding.
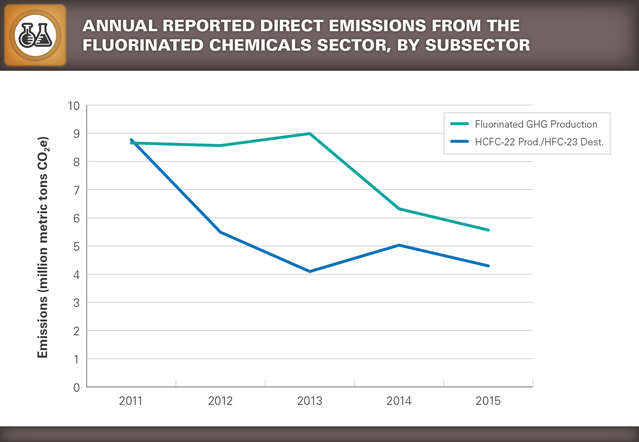
- Trend of Annual Reported GHG Emissions from Fluorinated Chemicals, by Subsector (as of 8/13/16).
- Location and emissions range for each reporting facility in Fluorinated Chemicals (as of 8/13/16).
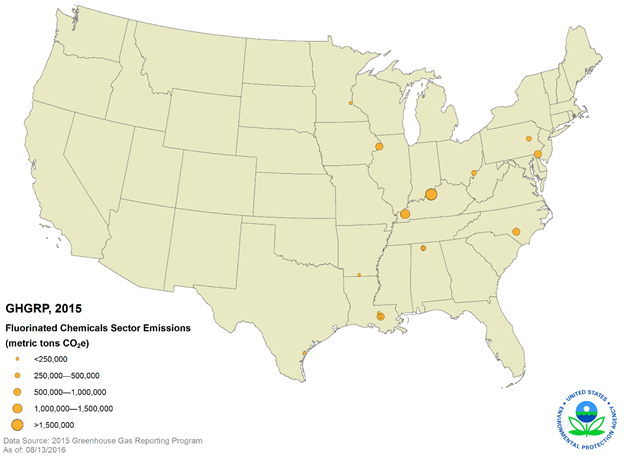
This map shows the locations of direct-emitting facilities. The size of a circle corresponds to the quantity of emissions reported by that facility.
| Fluorinated Chemicals Subsector — Greenhouse Gas Emissions Reported to the GHGRP (all emissions values presented in million metric tons CO2e) |
|||||
| 2011 | 2012 | 2013 | 2014 | 2015 | |
|---|---|---|---|---|---|
| Number of facilities: | 16 | 16 | 16 | 15 | 15 |
| Total emissions (CO2e): | 17.4 | 14.1 | 13.1 | 11.4 | 9.9 |
| Emissions by greenhouse gas (CO2e)
|
0.8 ** ** 16.6 |
0.8 ** ** 13.3 |
0.8 ** ** 12.3 |
0.8 ** ** 10.5 |
0.8 ** ** 9.1 |
Totals may not equal sum of individual GHGs due to independent rounding.
** Total reported emissions are less than 0.05 million metric tons CO2e.
| Number of reporters and 2015 emissions (CO2e) for the Fluorinated Chemicals industry subsector |
||
| Industry Sector | 2015 Number of Reporters | 2015 Emissions (million metric tons CO2e) |
|---|---|---|
| Fluorinated GHG Production | 14 | 5.6 |
| HCFC-22 Production/HFC-23 Destruction | 4 | 4.3 |